
YouTube Analytics: How to use the tool to measure your channel’s results and boost your videos
Complete tutorial to check and understand the data generated by your audience on YouTube!

What will we see in this post
If you have a YouTube channel, you’ve probably already noticed that creating a brilliant video isn’t enough in order to have incredible results. First of all, you need to analyze what does and doesn’t work for your audience, and understand how you can improve your content.
Checking and understanding the data generated by your audience is of critical importance to make your business evolve. Knowing, for example, whether people are watching on average 30% or 90% of the duration of your videos can help you shape your content and deliver even more value.
It’s worth mentioning that each channel has its own particularities. So, there is no universal standard for comparing data.
For example, there is no way of telling how many comments or shares are expected for a certain number of views.
Besides, YouTube doesn’t provide a lot of information for referencing, because this could encourage certain user practices aiming to deliberately fool the algorithms.
Therefore, your best reference is the data from your own content and, in this post; we’re going to show you a few ways to perform this analysis.
Let’s get started?
What is YouTube Analytics and what is it used for?
First of all, you need to understand what YouTube Analytics is. It’s a metrics tool available on the platform itself. It helps you monitor the performance of your videos and your channel.
The tool provides daily updated reports with information about traffic source, audience demographics, number of subscribers, video viewing time, comments, and shares.
But what is YouTube Analytics for and why is it so important?
YouTube Analytics allows you to monitor your channel’s metrics and results on the platform.
It’s through this data that you are able to understand whether the audience likes the content you produce, and what can be done to improve your videos’ performance.
Accessing the YouTube Analytics data
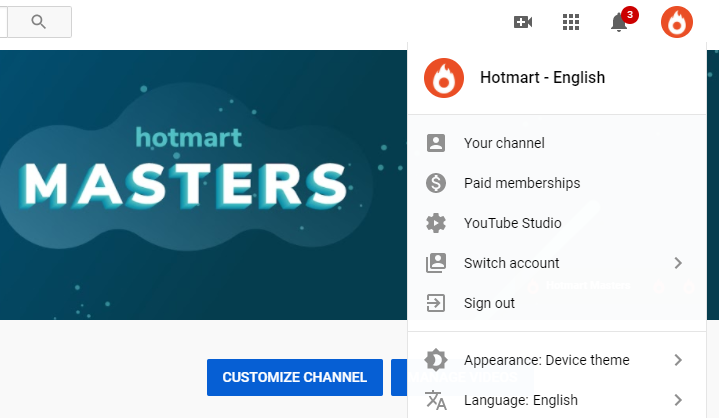
First, let’s go to the YouTube Analytics dashboard. To do so, login and click on your account photo on the top right corner. Then, click YouTube Studio.
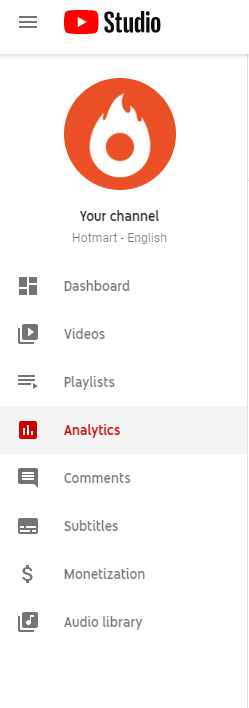
On the next screen, click Analytics in the left side menu, and you’ll have access to various available data.
This first screen displays an overview, compiling various information, such as watch time, average view duration, number of views, etc. In the left side menu itself, you can access each item separately for further details.
As soon as you access this dashboard, data relative to the entire channel is displayed. In order to analyze a specific video or playlist, just use the content search field.
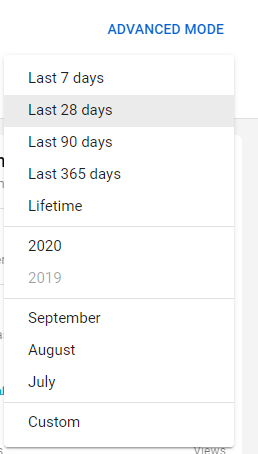
On the right of this field, you can also specify a time period, for example: last 7 days, month, this year, etc.
Important tip: If you select a playlist to analyze, you should know that the data displayed will be relative to accesses from the playlist itself, disregarding the individual numbers of accesses for each video.
The analysis of a playlist’s data can lead to misinterpretation by the user. As a simple analogy, it’s as if you ordered a dish (of food) from YouTube and it provided you with a dish, but without any food. Such a situation wouldn’t be technically misleading, because you would literally be receiving what you ordered, but this would certainly create major frustration.
For example, let’s suppose that you have a video called How to make chocolate truffles and this video is part of a playlist called Confectionery Recipes, in your cooking channel.
If the video, How to make chocolate truffles, has been displayed individually on a blog or has received several hits by means of YouTube searches, this doesn’t mean that the data generated by these views will impact the data in your Confectionery Recipes playlist. In other words, when you’re analyzing a playlist, the values presented will refer only to the playlist itself, and not to the sum of the videos that are part of it.
So, how do you analyze all the videos in a playlist, regardless of the source of individual accesses?
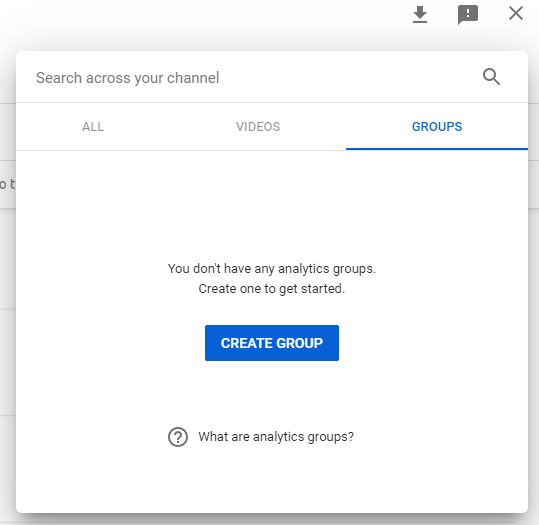
To do so, you need to create a group. You can do this by clicking on Groups, on the top part of the screen and then, click on Create group.
How to analyze your channel’s data
As we mentioned earlier, your own videos are your best parameter reference. So, make good use of the Comparison tool, located on the top of the screen. This way, you can place video, playlist or group data side by side and draw your own conclusions.
As you will notice, there’s a lot of data available. In order to make everything clearer, let’s rely on a few questions to better understand what each YouTube Analytics section means.
For example:
- How is my channel performing?
- Who is the audience watching my videos and what are they interested in?
- What is their level of engagement?
1. Channel performance
Your channel’s performance can be measured by the progress of watch time, the number of views, and the number of subscribers.
Watch time
Watch time is one of YouTube’s most important performance metrics. It shows the audience’s interest in the content and the time they spend watching it.
This metric is shown in minutes and you can perform an analysis together with audience retention. This retention percentage can be displayed in absolute or relative terms.
Engagement
Engament concerns only the video chosen for analysis. On this screen, you can see the average and the chart that shows the performance over time.
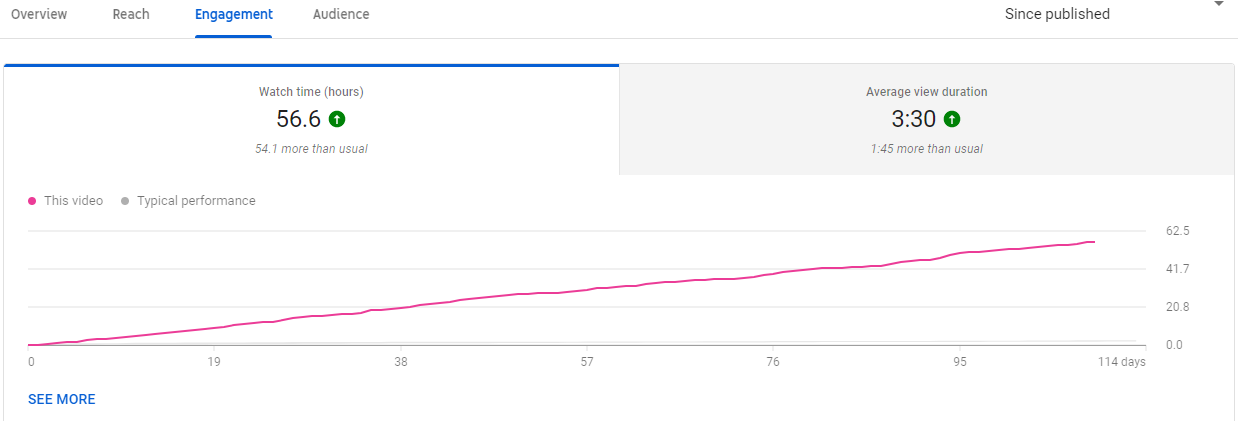
The average percentage is greatly affected by the videos’ duration. Shorter videos, under 2 minutes, will probably have a higher average . Long videos, with a duration of 30 minutes, can usually barely reach 40% of total video time. Remember this when you compare videos with very different sizes.
This screen can provide you with great performance indications.
It’s worth paying attention to the curve on this chart, especially during the initial 15 seconds. If it goes down too abruptly, this might be an indication that you’re not able to convince your viewer to keep watching your videos.
One suggestion is to analyze your intros and check out if they are interesting, or if they are clear about the content the video covers. In the beginning, a loss in retention rate may also be the result of misleading thumbnails.
If at any point, the chart’s curve goes back up again, this shows that segment has created greater interest, and may indicate that part of your audience even went back to that point on the video. Try to understand what your viewers might have liked the most. Create your hypotheses and try to replicate the effect in your next videos.
Likewise, analyze the moments of loss of retention and try to find the reason for it in order to avoid weak points. These observations can help you plan the best places to add CTAs, for example.
Number of views
The number of views is perhaps the most evident metric on YouTube. Many people believe that it’s the determining factor for a video or channel’s success.
However, in certain cases, the number of views might represent a vanity metric, i.e., information that impresses when evaluated out of context, but that doesn’t necessarily provide practical results.
For example:
Let’s suppose that your video teaching your audience to make chocolate truffles has been mentioned occasionally on Twitter by an influential web celebrity. Because of this, on that day, it was accessed 10 times more than your other recipe videos.
Despite the great number of views, retention was terrible, since most viewers only click on the link out of curiosity, watched it for a few seconds, and closed the video.
Over the next few days, everything went back to normal, and your channel didn’t obtain a growth in the number of subscribers, didn’t get more hits on other content, nor more engagement. In this case, a large number of views might not have generated any benefits for you.
Meanwhile, another cooking channel promoted its own video teaching people how to make chocolate truffles in a specific WhatsApp group, with people highly interested in the subject.
This competitor’s video, compared to yours, had less than 10% of views, but it benefited much more from the selected group it reached, gaining subscriptions and generating greater engagement.
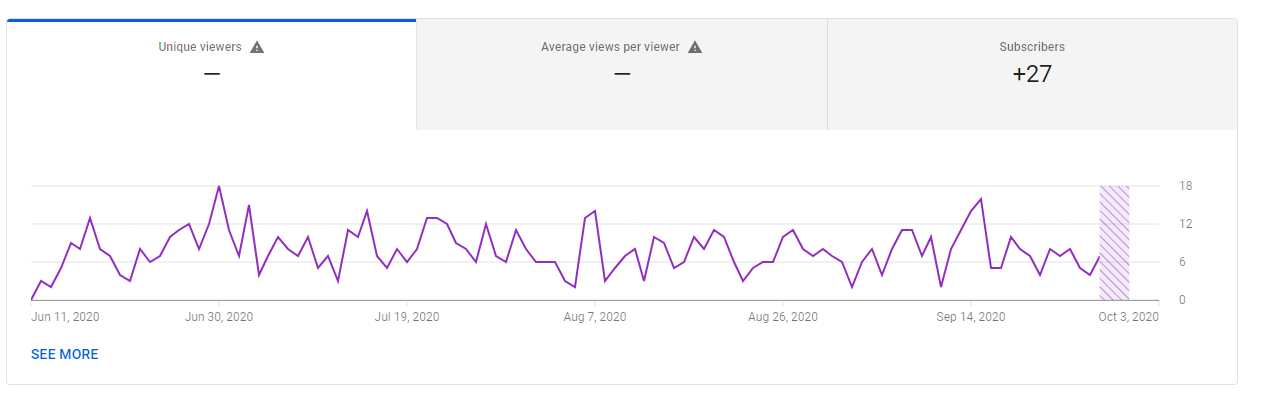
Number of subscribers
The number of subscribers is an important gauge to assess your channel’s growth. Subscribers can watch your content up to twice as much and help a lot in initial views when you post something new because they are notified about new uploads.
A video’s performance during the initial hours can determine its success in terms of ranking. Thus, these viewers who chose to follow you help improve your numbers significantly.
You can evaluate the number of subscriptions obtained for each video, as well as the number of subscriptions lost. Analyze which videos have gained the most subscribers and those that have caused subscription cancellations. Formulate a hypothesis to explain this behavior.
You can test new ways of encouraging your viewers to subscribe by using CTAs in different video sections, including banners, or even by using invitations in the comments section, attached at the top. Monitor your results through Analytics and find what else works for you.
2. Demographics
Understanding your channel’s demographics will help you create better content for your audience.
In order to view this information, go to Demographics, in the left side menu. There, you’ll be able to learn what percentage of your audience is male or female, what age groups are the most prevalent, in addition to location by country.

Gender, age, and country
Let’s suppose that your cooking channel has an 80% male audience. If you believe that your content is equally valuable for men and women, you can try to find the cause of this gender difference among your viewers.
Could it be because of your visual identity, description, textual style or identification with the person presenting?
This way, you can choose to implement changes to attract more women to your channel or perhaps, change your strategy and decide to focus entirely on the male audience, if you feel that this is a more promising niche for you.
The same goes for viewer age analysis. Knowing exactly which age group watches your videos the most, you can make sure if the style being used (either in how it’s presented or editing style), makes sense to your audience and thus, make adjustments.
Devices
It’s also a good idea to investigate the data regarding devices.
We know that video views on smartphones have increased dramatically over the last few years and that this is a trend that should continue. But there are differences in the behavior of those who watch videos on cellphones or on desktops and laptops.
Longer videos, or those that require greater immersion, such as software tutorials, are more likely of being viewed on computers, since users benefit from a larger screen and probably, from a quieter and more controlled environment.
Going back to our hypothetical example of a cooking channel, let’s suppose that you’ve realized that access from smartphones and tablets has surpassed access from computers.
With this information, you can ask yourself, “Are viewers watching the videos on their phones while trying to prepare the recipes in the kitchen?”
If so, this might indicate that you need to pay more attention to the size of letterings and visual information; after all, cellphone screens are small. Similarly, this information can lead you to be more careful with the audio.
If people are watching the videos while preparing the recipes in a noisy environment, you can consider doing without background soundtracks and prioritize clearer audio, with as little interference as possible.
Traffic source
Traffic source information shows you how your viewers reach you.
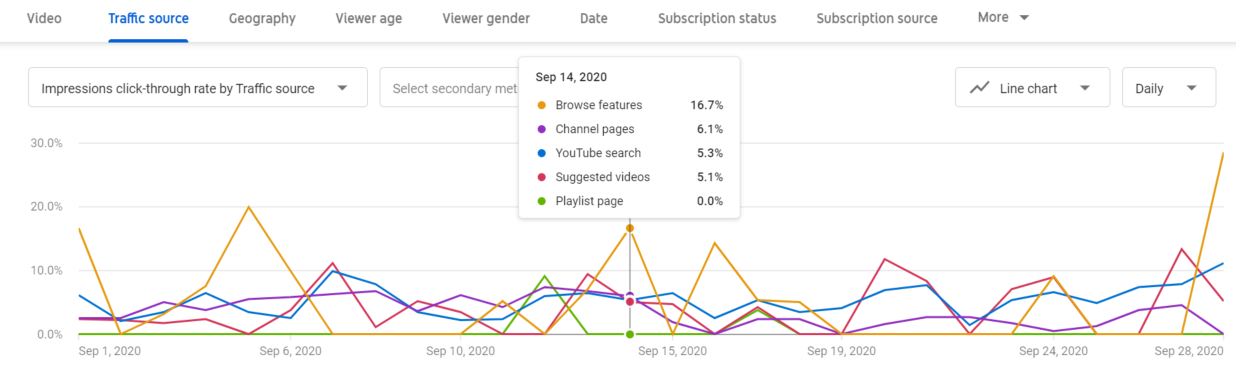
If, when analyzing this data, you find that a large part of your audience originates from suggested videos, YouTube searches and browsing features, this may indicate that you have done a great SEO job; after all, your audience has found your content in an organic manner.
If you notice that most of it comes from external sources, it’s worth investigating which websites are generating this traffic for you. If you find a specific blog or page, perhaps it’s the case of contacting them and create partnerships or collabs in order to boost these views.
Top searches
Evaluating YouTube and Google’s top searches leading to your channel is also a great way of better understanding your audience and what they search. To do so, after clicking on Traffic Source, in the left side menu, go to YouTube Search in the section that appears below the chart.
Going back to our example, if you notice that most searches are related to vegetarian recipes, it might be a good idea to focus a bit more on this type of cuisine.
3. Level of engagement
And finally, we can evaluate viewer actions through YouTube Analytics, i.e., their engagement.
Like and dislike
A great way to see if our content is liked is by checking out like rates, presented as likes and dislikes.
Users can like or dislike your content and, like other types of metrics, you need to be careful about what these numbers represent.
Of course, it’s expected that the great majority of viewers mark your video as liked. This helps other users to see whether watching your content is worthwhile. However, being marked with a dislike doesn’t always indicate problems with your production.
For example:
A video showing a news story about corruption might receive many dislikes, because the viewer’s intention is to show their disapproval for the acts of corruption.
Because of this, there are strong indicators that negative votes don’t harm a video’s ranking, and in certain cases, might even help, because they only show that the content has generated audience reactions, i.e., greater engagement.
Since these cases are usually exceptions, we recommend that you always create content that leads users to mark your videos with a like.
Comments
Comments are another very important engagement metric.
Besides helping rank the videos, you can learn directly from your audience. Therefore, it’s always a good idea to encourage your viewers to comment.
You can include a line in your script asking your audience to comment on something very specific. For example, “Which part of this video did you like the most, and would you like to learn more?”, or “What would you like me to talk about in the next video?”.
By performing these types of tests and monitoring the numbers through YouTube Analytics, you’ll have a good idea of what works or doesn’t work with your audience. And never fail to encourage dialogue in the comments section, because this will help in viewer engagement even more.
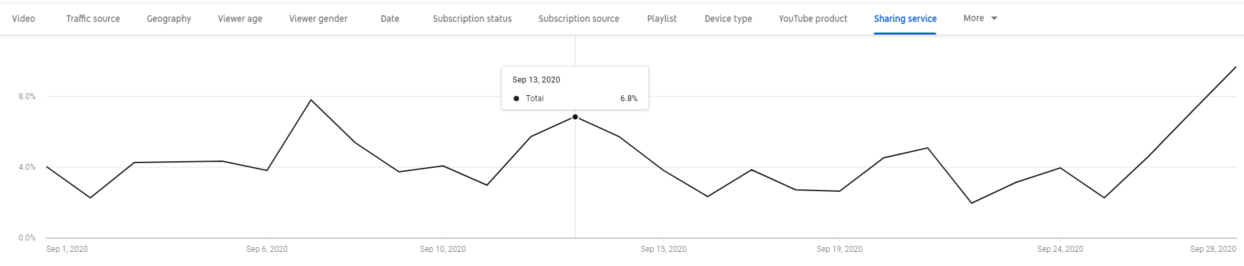
Shares
Analyzing the number of shares can help you determine which type of content is ideal if you wish to expand your channel’s reach.
In this section of YouTube Analytics, you can also see where your videos were shared the most and use this to your advantage.
For example:
If you notice that your videos are being shared a lot on Facebook, perhaps it might be a good idea to further improve your presence on this network and work on a strategy linking both platforms.
Conclusion
An important point when evaluating engagement metrics is understanding that each type of video can generate a different action by viewers.
For example:
A video in which you try to establish a conversation with the audience you already have might not generate many shares, but it generates many comments.
On the other hand, a video that seeks to reach new people needs to have a high share rate, but might not benefit as much from a large number of comments.
And finally, a video that aims at answering a question might benefit more from the number of likes, without necessarily having an expressive number of shares or comments.
All this will depend on the strategy and goals you outline, and YouTube Analytics is the best tool to guide you through this process!
In order to learn more about YouTube Analytics and YouTube strategies, we recommend that you go to the Creator Academy, which has great information made available by Google and YouTube!
And, if you wish to learn how to make money with your channel, make sure you read our tips on how to generate revenue from internet videos.
See you next time!