
Data Science: How to Use It to Make Your Business Grow
Learn more about this field of studies that helps you make more assertive decisions.

What will we see in this post

Data science is what drives the success of everyone, from the big tech companies down to brick-and mortar-businesses looking to make the jump to digital sales. Data science, machine learning, AI, and big data are the buzzwords of this new sales tactic, but how does it all work?
We’re going to answer, “What is data science?”
These technologies are actually simpler than they look. But before we move on to practical examples, let’s take a deeper dive to better understand what is data science.
What is Data Science?
Here’s a quick and functional data science definition.
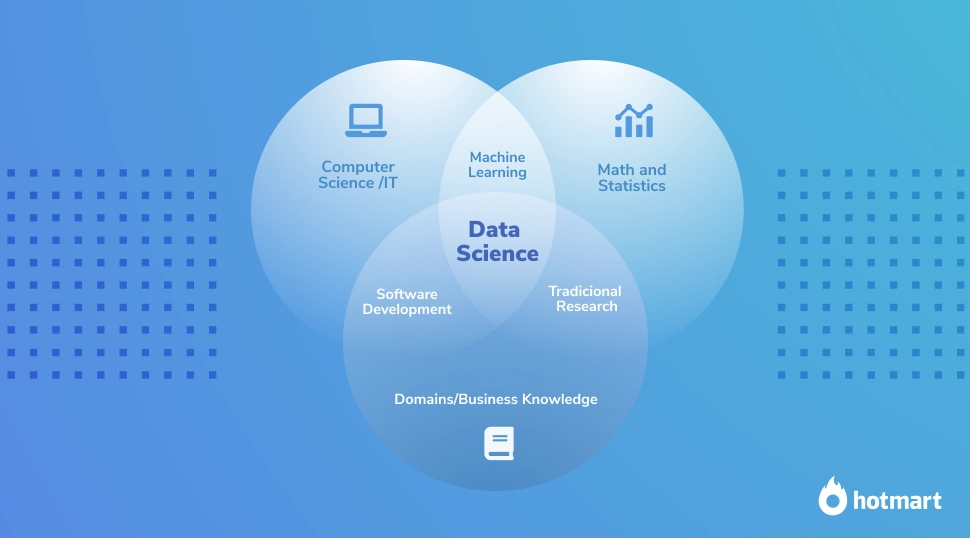
Data science is the field of studies that uses scientific methodology to extract knowledge from data used to support decision-making. Data science is a type of digital learning that companies use to boost sales and performance.
Making the best decision is not always easy, and that’s why data science is a multidisciplinary field encompassing knowledge of math, statistics, computer science, and business.
The good news is that technological advances have led to greater democratization of data science processes. Today, many tools can help ordinary people to use data science in business, even without knowledge of statistics and math. But it is essential to learn what data is science and what it involves, even if you won’t have the technical skills.
In this post, we will give you some practical examples of how people are using these techniques to make better decisions, increase sales, and make their businesses grow.
Difference between data science and business intelligence
Knowing the difference between what is data science and what is business intelligence is the key to making the most out of both of these types of information-gathering. Your company is building up a storehouse of knowledge, and both of these types of data analysis can make use of that information.
Data science uses information to make predictions about future events in your business. Data science is often used to help tackle a specific problem, just to increase sales during a new product launch. Data science helps provide prescriptive solutions to future events.
Business intelligence looks at the historical information that your company has gathered and helps present that in a way that is useful for stakeholders. Business intelligence looks at trends, sales, and other information you have already built up to communicate the state of your business.
Each of these different types of knowledge gathering use different skills and have different scopes and uses. Here’s a handy breakdown of how each works.
| Data Science | Business Intelligence | |
| Type of Data | Predictive—What can happen? | Descriptive—What has happened? |
| Scope of Study | Goal-oriented and focused on a single problem | Can be broad and cover your entire business or as specific as needed |
| Data Use | Uses external data such as market trends, information from competitors, as well as internal data | Uses data your business has already gathered like sales information, budgets, and key metrics |
| Skills Needed for Analysis | Data scientist using programming languages like Python, statistical software, and algorithms | Business analyst or self-service tools that any business owner can quickly pick up |
What is the definition of ‘VAST’?
VAST represents a change in how we approach data science and information gathering. Rather than simply focusing on one particular section of information, VAST uses new technologies to gather data from a wider field much more effectively than ever before.
The good news is that technological advances have led to greater democratization of Data Science processes. Today, many tools can help ordinary people to use Data Science in business, even without knowledge of statistics and math.
In this post, we will give you some practical examples of how people are using these techniques to make better decisions, increase sales, and make their businesses grow.
In practice, how does the Data Science process work?
Putting theory aside, the first step to start using Data Science in any kind of business is to understand, in a practical way, how the process works and what the necessary stages to make the best decisions are.
What is Data Acquisition?
The collection of any data is often done under the “5 Vs of Big Data,” which are Volume, Value, Variety, Velocity, and Veracity. Let’s take a look at each of them in detail.
- Volume—This simply refers to these signs or amount of data that your business will be gathering.
- Value—Value is often the most important factor for businesses. This refers to the benefits that your company hopes to achieve by using data science.
- Variety—This refers to the types of data you will be working with, including raw and unstructured data.
- Velocity—This is the speed at which your business generates and stores new data. This could be by the day, hour, or even minute.
- Veracity—This is the accuracy of the data. The greater the accuracy, the higher your confidence can be in the success of your data science project
What does a Data Scientist do?
We’ve still got one big question about data science. What do data scientists do?
The data science process is a little complicated. We’ve broken it down into seven easy steps that all data scientists go through. They may use different tools, programming languages, and statistical methods, but these are the seven steps that all data scientists go through before a decision can be made using the information.
1. Mapping Questions > 2. Collecting Data > 3. Processing and Organizing Data > 4. Data Analysis > 5. Development of Models and Algorithms > 6. Visualizing Data > 7. Decision-Making
1. Mapping Questions
Usually, the data science process begins with a question that needs to be answered. Below, we have listed 10 common questions for people who work with digital products.
- What will my turnover be in the next months?
- What would happen if I changed the design of the product page completely?
- What is the right moment to approach a customer and offer my product?
- What characteristics should a successful affiliate have to sell my product?
- How much do I need to invest in traffic to obtain the result “X”?
- What is the ideal price for my product?
- When do I offer a new product to my customer?
- How many emails do I need to send to the lead before offering my product?
- What is the best format to promote my content: posts or video?
- What is the best month for my launch? And what is the best time to start the sales?
2. Collecting Data
Then, it is necessary to collect data that may help us answer the questions. This data may come from different sources, such as:
- Systems and applications
- Internet search
- Data from organizations and companies
- Surveys
The truth is that there are myriad sources of data, and it’s extremely important to find a source that presents information in a trustworthy, structured way. These sources can be your key metrics, sales data, or customer demographics. Let’s take a look at some more examples:
- To predict your turnover for the next months, it may be interesting to analyze your turnover up to this moment. To do so, you need your sales history. On the other hand, if you understand that your sales results are directly connected to the traffic volume of your website, it is possible that you will find the necessary data to answer these questions with an analytics tool.
- To find out the correct time to approach the customer and offer your product, you may need to analyze every action taken with former customers. This may be done with both customers who purchased your product and those who didn’t to understand the reasons why some customers bought the product and why others gave up.
- If your question is about the format of content that achieves the best results, posts, or videos, you will need to cross-reference the data from the engagement of leads that read your posts, which can be obtained from Google Analytics, for example, and the data from the engagement of leads who watched your videos from YouTube Analytics.
3. Processing and Organizing Data
After the data has been collected, it’s important to clean, standardize, process, and organize the information. This happens because, frequently, the data generated comes with inconsistencies that may hinder the analysis and lead to the wrong decision being made.
When the data has been organized and processed, you will be able to start the analysis.
4. Data Analysis
There are many kinds of analysis, from simple to extremely complex. But it’s important to remember that most of the time a basic analysis may result in a valuable outcome for the business.
The reason why this occurs is a very simple one: As many people and companies still don’t have the habit of looking at numbers, the ones who start analyzing data (even a simple analysis) are usually one step ahead of the competition.
5. Development of Models and Algorithms
When data analysis becomes very complex or ends up generating more questions than answers to the initial question, it may be a sign that you need to develop statistical models and algorithms to find the solution that will bring more value to the business.
These models and algorithms are usually necessary when the “human mind” can no longer find the best patterns to solve the problem or when finding a solution to the problem can take too much time.
An algorithm may be used to find patterns that escape human perception or even to analyze millions of scenarios in a few minutes, leading to a more assertive decision in a short period of time.
In the example below, we can see how this works.
If I have a base of 5,000 leads, and I’ve sent seven email messages per month to them in the last four years, there are more than 1.6 million events that I would need to analyze to find a behavioral pattern for my leads.
Even if I concentrated all my efforts in this analysis, it would probably take too long to find patterns that an algorithm would identify in seconds.
If I want to understand the best way to promote products on Facebook, I could analyze over 50 different indicators for every ad I have ever run.
But how would I find out which indicators are really relevant to my audience?
If I want to test which details in my page’s design increase the chances that the visitor will buy my product, I would have to:
- Create many pages;
- Divide users into groups that would access each of these pages; and
- Find a way to ensure that the user in a certain group would have access to only one page until I finish analyzing the results of all of them.
This may look very complex, but it can be done in a simple way with some applications.
6. Visualizing Data
After the use of models and algorithms, you will need to visually analyze the results to make sure the conclusions are aligned with the object of the study.
This visual analysis is done through graphics that make it easier to detect patterns and make decisions.
7. Decision-Making
When the data is ready to be analyzed, we have reached the most important moment: making strategic decisions for your business.
When you verify the patterns, you will be able to notice what works and what needs to be improved. This will enable you to implement new actions and carry out tests to boost your results.
These decisions, of course, depend on the kind of business you have and which aspect you need to optimize.
The important thing is that after deciding on the action that will be taken, you analyze the data you already have and choose the most assertive decision.
VIDEO: How to measure the results of your online business with Bruno Andrade
Data science differences: Data Scientist, Data Analyst and Data Engineer
Now let’s look at the data scientist job description. There are actually three jobs that all come together to improve our use of data and business information: data scientists, data analyst, and data engineers.
Data Scientist
Data scientists have one of the most broad job descriptions in this field. They’re responsible for determining which questions need to be answered and then gathering the information needed to find those solutions.
Data scientists must have good programming knowledge in languages like SAS, R, and Python. They also need to be well-versed in statistical math, storytelling, and machine learning.
Data Analyst
A data analyst helps bridge the gap between data science and business information. They’re responsible for synthesizing and aligning the information that data scientists gather with the plans being made by executive leadership in the company.
A data analyst must have all the same skills as a data scientist, but they are less focused on the numbers and more focused on synthesizing the information into something that management can utilize.
Data Engineer
A data engineer is on the complete other side of the information pipeline. These specialists are responsible for designing and maintaining the infrastructure that we use to gather information in the first place. This is a highly technical position that is vital to data science, but nevertheless is not responsible for communicating that information to the business at large.
A data engineer needs the most specialized computer know-how, including knowledge of Java and Scala programming languages; working knowledge of NoSQL databases, including MongoDB and Cassandra DB; and the ability to manage frameworks like Apache Hadoop.
But how can I apply data science to make my business grow?
As it is a multidisciplinary field, data science may be applied in practically every challenge faced by people who run a digital business.
Some common example of the use of data science to achieve results in digital businesses are:
- Analysis of conversions in sales funnels;
- Data analysis of behavior from visitors on your pages;
- Pricing products;
- Detecting unusual behavior and fraud;
- Analysis of user response on social media;
- Systems to recommend products to customers;
- Predicting when a customer will stop paying for a subscription (churn forecast);
- Enriching and classifying leads with the objective of prioritizing;
- Turnover forecast;
- Classifying customers according to purchase behavior; and
- Optimizing sales baskets through a combination of products.
And finally, here are two practical tips for you to start using data science in your business today:
Tip 1. How to use web analytics to detect patterns in visitor behavior on your pages and sell more
One of the main advantages of a 100% digital business when compared to a brick-and-mortar one is the amount of information you can get your hands on online.
When you install an analytics tool on your website, you immediately start collecting information that may be analyzed to generate better results for your business.
Some examples of relevant information obtained from these tools are:
- Source of visit: Where your visitors came from or which link they clicked on to get to your page;
- Average time spent on your page;
- Pages and products viewed;
- Abandonment rate: The percentage of visitors who abandoned your page without clicking on any other link;
- Parameters of links the visitor clicked on: UTMs, SRC, SCK;
- Number of visitors who took a determined action on your website, for example, those who clicked on the checkout link or logged in. You will have to set up these actions on the analytics tool.
With basic knowledge of what is data science, you can use analytics tools that offer a series of resources for people who sell digital products on the internet.
After installing the tool, the metrics start being collected, and you have the data you need to make the best decisions.
Tip 2. How to prioritize leads based on data enrichment and lead classification
One of the best ways to sell more on the internet is to segment the way communication with each customer is done.
Offering a product at the right time, when the lead is likely to make the purchase, is one of the best ways of getting results without being seen as a spammer who only sends emails selling products all the time.
To carry out this kind of analysis and understand the best time to promote your product, you will basically need two tools.
The first one is an email marketing tool.
Then, you will need to use a tool such as Hotmart’s Automatic Lead Management (ListBoss) that enables you to integrate the Hotmart platform with the email marketing service you have chosen.
With the integration, you will be able to configure it so that your email marketing service receives events whenever your lead takes one of these actions:
- Cart abandonment
- Order canceled
- Chargeback
- Order approved
- Order claimed
- Order refunded
- Order expired
- Order complete
- Product downloaded
- Hotmart Club registration
- Product reviewed
This is the first point to help decide the right time to email to recover sales.
A customer who visited your checkout and abandoned the shopping cart has a greater chance of buying your product than a customer who doesn’t yet know you have a product to sell.
So, this will be a crucial piece of information for you to send a new email to this customer.
With all this information being registered in your email marketing service, you can start attributing actions to each case.
For example:
You can send a welcome email message when your customer downloads a product or a thank-you message when a customer reviews the product.
These actions lead to stronger relationships with your customers and helps earn the trust of your buyers.
Data Science: analyze your data
Now that you know what is data science, you’ve got the tools and strategies you need to make your business grow!
The tendency is that the complexity of analysis increases as the business becomes more mature and consequently presents a greater volume of information.
But the most important thing is to start collecting, organizing and analyzing data from your business. This is the real key to success!
If you’re looking for more tips about using data science to improve your business, we have more articles for you to check out!